
| We are making some updates to the SharePoint usage report within the Microsoft 365 admin center. In phase one, we are adding eight new metrics to the SharePoint usage report. In phase two, we are incorporating two of these new metrics – anonymous link count and company link count – into the definitions for active sites and active files. Thus the number of active sites and active files recorded in the usage report may change. We will also backfill the report with 180 days of data. Key points Timing: Phase 1: late January 2021, Phase 2: February 19, 2021 Roll-out: tenant level Action: review and assess How this will affect your organization When phase one has rolled out to your tenant, you will be able to add these metrics as columns to the report table and as part of the Microsoft Graph reports API: – Anonymous link count – number of times documents or folders shared using “Anyone with the link” – Company link count – number of times documents or folders shared using “People in org with the link” – External sharing – Site external sharable settings – Geolocation – Geo location of the site – Secure link for guest count – Number of times documents or folders shared using “specific people” and adding guests – Secure link for member count – Number of times documents or folders shared using “specific people” and adding members of the org – Site sensitivity label Id – Sensitivity label configured on the site – Unmanaged device policy – Site access policy for unmanaged devices For phase two, we are adding anonymous link count and company link count to the definition of active site and active files; we will then recalculate these metrics. We will update the active site chart and active file column in the SharePoint Site usage report to reflect anonymous link count and company link count metrics. We will also backfill the report with 180 days of data. What you need to do to prepare Share this information with anyone who reviews the SharePoint Site usage data or who leverages data in the Microsoft Graph reports API so that they are aware metrics may increase and that additional data will be available. Usage report: the highlighted areas are where new data may change the counts. 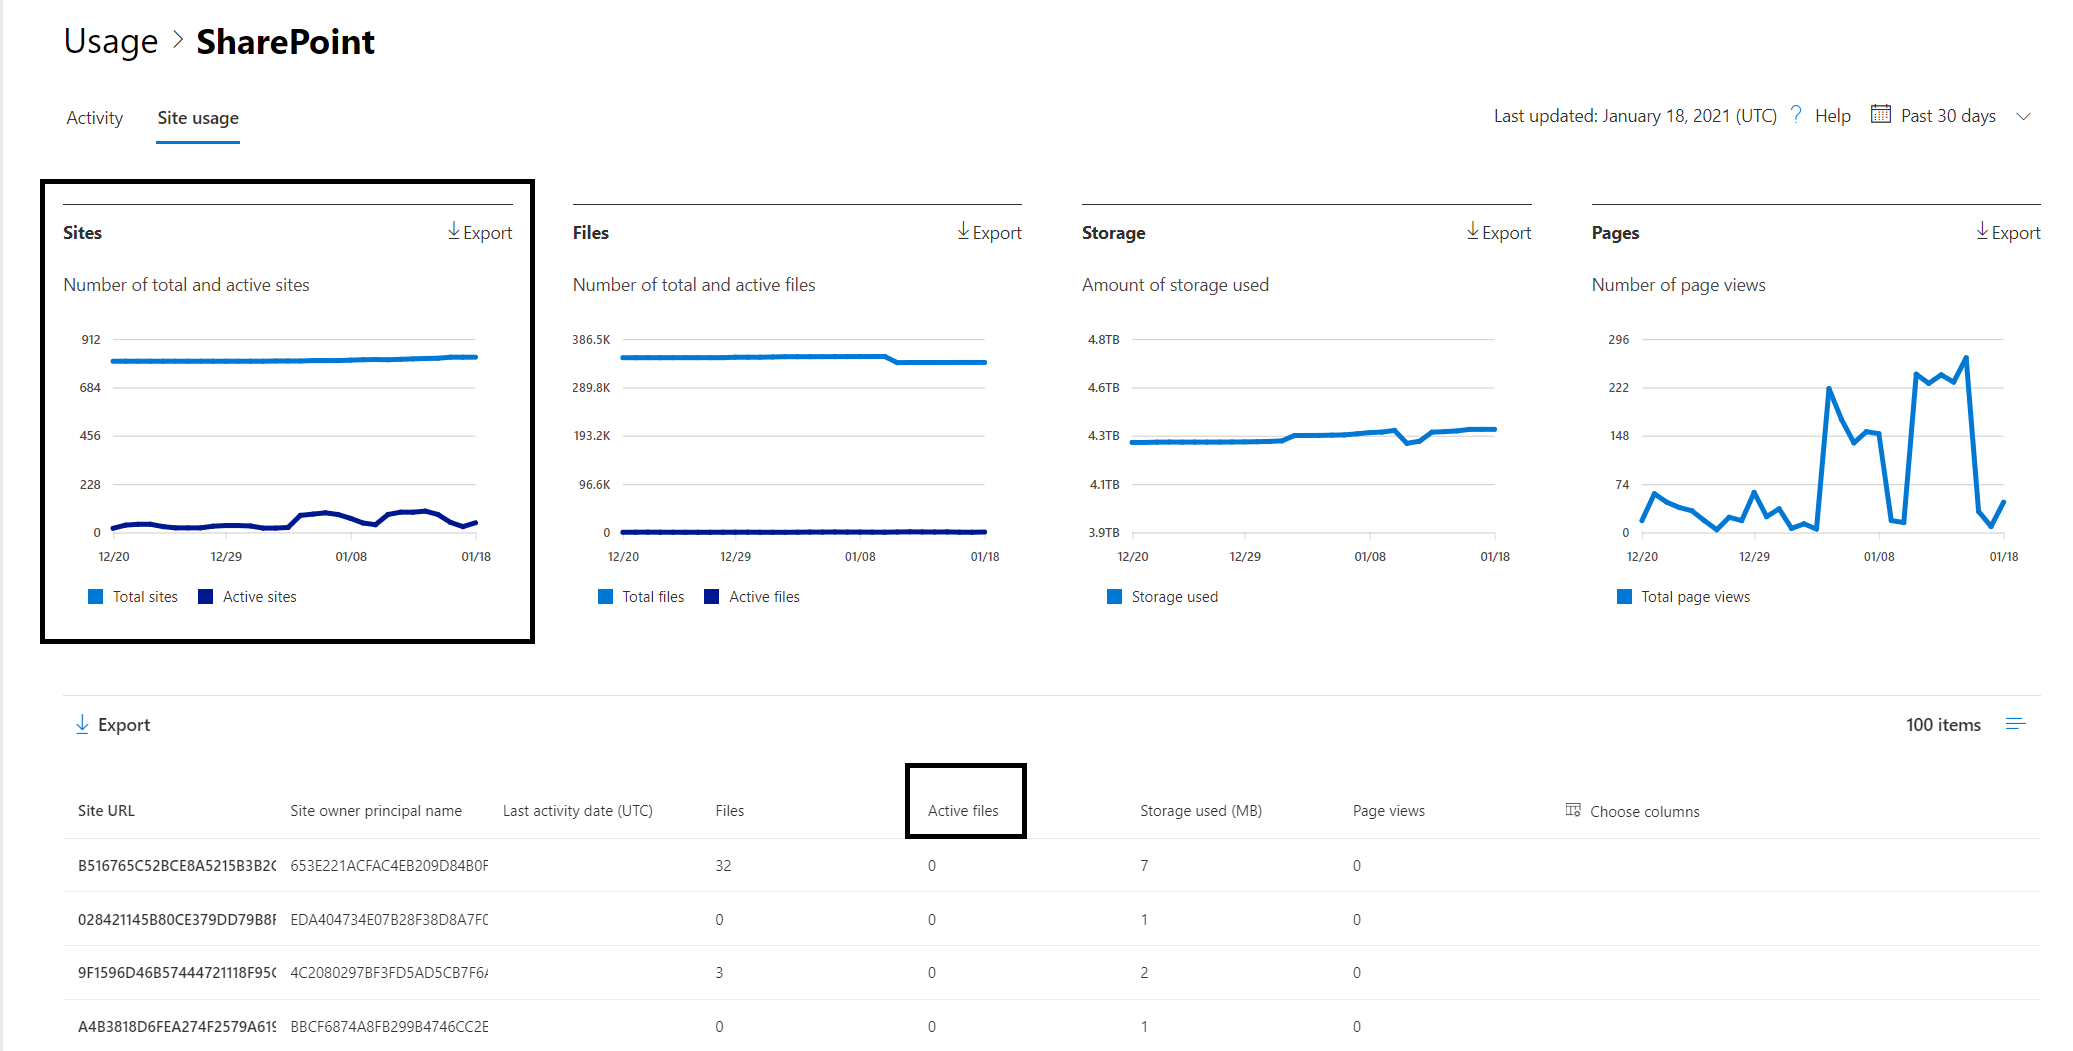 |
Bron: Microsoft
Recente reacties